Methods and caveats
For the reader who wants to check the work. Formats, calibrations, the run table, the discovery pipeline, the isotope budget with its uncertainties, and the limits set by information that no longer exists.
1. Source material
32 .PHYS files from NSSDCA in four folders: 5289 and 5631 (Viking 1), 5388 and 5967 (Viking 2). Five microfilm frames of run 10039 (scans 10–14) paired with hex dumps of the matching digital records. Biemann et al. 1977 Table 1 for the run schedule and Rushneck et al. 1978 for the instrument. Instrument facts used below, from those papers: Nier-Johnson double-focusing magnetic sector, 70 eV electron impact source held at 225 °C for soil analyses, accelerating voltage scanned exponentially from 2350 V to 125 V (m/z ≈ 12 to 215) every 10.24 s, 3840 samples per scan, each sample the logarithm of the electron-multiplier current digitized to 9 bits. Oven set-points 50, 200, 350 or 500 °C, flash-heated and held for 30 s total; the volatiles are swept onto a Tenax-GC column held at 50 °C for 12 min, ramped to 200 °C over 18 min, and held for 18, 36 or 54 min.
2. Profile-tape format (5289 / 5967)
Viking 1 (5289). Frames of 3344 bits (418 bytes) located by a fixed start signature; frame spacing is exactly 3344 bits for 100 % of frames. A 74-byte header holds a millisecond clock at bytes 8–10, the frame-within-scan index at byte 49 and a reset counter at byte 57. The remaining 344 bytes hold 86 four-byte chunks, each three 9-bit big-endian values plus five pad bits, giving 256 values per frame; 15 frames make the 3840-channel scan and the 16th carries engineering data. Values are inverted (signal = 511 − x, the 9-bit complement). An independent parser built from this description reproduces the committed 2019 CSV for file F00001 at 99.966 %; the three differing scans (0, 198, 426) are the documented frame-writer resets.
Viking 2 (5967). A perfectly periodic 62416-bit scan record (autocorrelation 0.754 at that lag, and the file tiles into exactly 410 records with zero remainder). Values are stored one per 16-bit word, in reversed mass order, not inverted; 99.9 % of words are below 512, so it is the same 9-bit log data under different packing. Reproduces the committed CSV at 100 %.
Log encoding. Rushneck (1978, Fig. 12) shows the log electrometer spanning roughly 10−13 to 10−6 A over 0–5 V, i.e. about 70 codes per decade. The analysis de-logs with 20.05x (66 codes per decade) for relative work only. Absolute currents from the profile tapes are not claimed.
3. Mass calibration
ln(m) = a + b · channel, fitted iteratively on the anchors {12, 16, 18, 22, 28, 44} after a two-point initialization on m/z 12 and 44. Results across all 16 runs: a ≈ 2.47 (VL-1) / 2.45 (VL-2), b ≈ 7.62 × 10⁻⁴, residual RMS 0.18–0.74 channels. One channel is 0.034 m/z at m/z 44 and 0.16 m/z at m/z 215, so the calibration is better than 0.1 m/z through the organic range and about 0.1 m/z at the top of the scan. A quadratic term is negligible. m/z 112 and 114 are 23 channels apart.
4. Run-ID recovery and tape taxonomy
A bit-level search for the 32-bit pattern [runID:16][0x0001:16] over run IDs 10015–10041 finds the pattern once per scan record in every 5631 and 5388 file and nowhere in 5289 or 5967. The archive's "full / reduced" labels are therefore reversed: 5631 and 5388 are the run-labelled, integer-m/z science product; 5289 and 5967 are the 3840-channel profile data with identifiers stripped. Every row below was checked against Biemann 1977 Table 1 (p. 4644) during the September 2026 error check and matches.
| File | Run | Sol | Oven °C | Sample | Mode / gas |
|---|---|---|---|---|---|
| 5631 F02 | 10015 | 17 | 200 | VL-1 sample 1, subsurface, Sandy Flats | hydrous, 13CO2 |
| 5631 F03 | 10018 | 23 | 500 | VL-1 sample 1, subsurface, Sandy Flats | anhydrous, 13CO2 |
| 5631 F04 | 10023 | 32 | 350 | VL-1 sample 2, surface, Rocky Flats | hydrous, 13CO2 |
| 5631 F05 | 10024 | 37 | 500 | VL-1 sample 2, surface, Rocky Flats | hydrous, 13CO2 |
| 5631 F06 | 10025 | 43 | 500 | VL-1 sample 2, surface, Rocky Flats | hydrous, 13CO2 |
| 5388 F02 | 10032 | 24 | 200 | VL-2 sample 1, Bonneville duracrust | H2 expansion |
| 5388 F03 | 10033 | 26 | 350 | VL-2 sample 1, Bonneville duracrust | H2 expansion |
| 5388 F04 | 10034 | 35 | 500 | VL-2 sample 1, Bonneville duracrust | H2 expansion |
| 5388 F05 | 10035 | 37 | 500 | VL-2 sample 1, Bonneville duracrust | 13CO2 |
| 5388 F06 | 10036 | 41 | 50 | VL-2 sample 2, under Badger Rock | H2 expansion |
| 5388 F07 | 10037 | 43 | 200 | VL-2 sample 2, under Badger Rock | H2 expansion |
| 5388 F08 | 10038 | 45 | 350 | VL-2 sample 2, under Badger Rock | H2 expansion |
| 5388 F09 | 10039 | 47 | 500 | VL-2 sample 2, under Badger Rock (chlorobenzene run) | H2 expansion |
| 5388 F10 | 10041 | 61 | 500 | VL-2 sample 2, under Badger Rock | 13CO2 |
F01 on each tape is the cruise blank. It has no Biemann Table-1 ID; the repository README assigns 10008 (VL-1) and 10007 (VL-2). "H2 expansion" is Biemann's hydrogen expansion mode, in which the oven is filled with hydrogen at about 0.5 atm before heating instead of being purged with 13CO2.
5. Full-tape record format and the Rosetta stone
Each scan of 5631 / 5388 is a uniform 1282-byte (10256-bit) bit-packed record anchored at the run-ID header. Word 0 is the run ID, words 2 and 7 are scan and peak counters, word 6 is 0x7FFF sync, words 114–132 are a 19-channel engineering block mirroring the profile tapes' 16th frame, and 204 four-byte intensities begin at word 209 (3344 bits after the header). The intensities are stored in descending mass order; after reversal, index i is m/z 12 + i, covering 12–215.
value = (b0·2^16 + b1·2^8 + b2) / 2^24 × 2^(b3 − 64)IBM System/360 hex-float readings (exponent first, exponent last, byte-reversed) all give absurd dynamic ranges (1027–1051). The base-2 reading above is confirmed two ways: clean mantissas are normalized in [0.25, 0.5), and the OH/H2O ratio stays continuous (0.20–0.32) across exponent boundaries under base 2 but jumps tenfold under base 16. Decoded record 10 of run 10039 (the first unclipped scan after the microfilm frame), on the lander scale: H2O 1.58 × 10¹⁰, OH 4.08 × 10⁹ (0.26 of water), CO/N2 1.39 × 10⁹, CO2 5.2 × 10⁸, O 5.1 × 10⁸, Ar 2.0 × 10⁸, O2 1.7 × 10⁸, C 1.4 × 10⁸. Record 9 itself has water at the 7.90 × 10¹⁰ clip and an OH/H2O of 0.94, because only m/z 18 clips.
Intensity scale. The stored floats are on one scale per lander: water clips at the same raw code, 9.302983 × 10¹² on tape 5631 and 9.119027 × 10¹² on tape 5388, in every run that saturates, and the microfilm frame for run 10039 "scan 10" (0-based record 9) is one of those clipped scans at the microfilm full-scale value 7.90 × 10¹⁰. All intensities are therefore scaled by 7.90 × 10¹⁰ / clip code. The July analysis anchored each run to its own strongest early water scan (and anchored record 10 rather than 9 for run 10039), which put runs on scales differing by up to 12.5×; ratios and elution times were unaffected but every absolute number in the v1 report is on that inconsistent scale. Whether the clip code corresponds to the same physical current in every run is not recoverable without the per-frame normalization constants printed on the microfilm.
Corrupt scans. Some records decode to garbage (a block of consecutive masses at enormous intensity; 0.3 % of values have the exponent byte's top bit set and read as ~265). A scan is dropped if its five strongest masses span five m/z or fewer, or if its maximum exceeds 1012 on the lander scale. This removes 3–9 scans in most runs, 85 in 10038, 137 in 10032 and 371 of 411 in 10033, which is mostly unusable.
6. Oven temperature
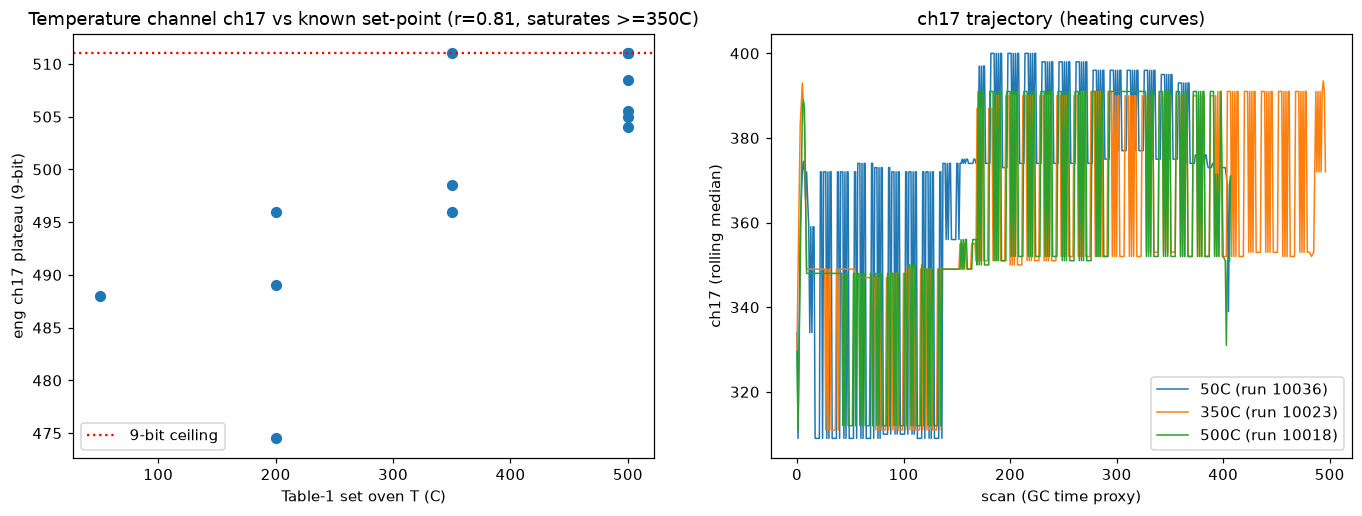
With the run-ID mapping supplying known set-points, the engineering channel whose plateau best tracks temperature is ch17 (r = +0.81 over 14 runs; plateau = 75th percentile of the second half of the run). It is compressive and saturates at the 9-bit ceiling of 511.
| Set-point | ch17 plateau | Runs |
|---|---|---|
| 50 °C | 488 | 10036 |
| 200 °C | 486 ± 11 (474, 489, 496) | 10015, 10032, 10037 |
| 350 °C | 502 ± 8 (496, 498, 511) | 10023, 10033, 10038 |
| 500 °C | 508 ± 3 (504–511) | seven runs |
A linear fit leaves an 87 °C residual and the channel does not separate 50 °C from 200 °C (run 10015 at 200 °C reads 474, below the 50 °C run). The practical result is that oven temperature is known exactly to the Table-1 bins through the run ID, and no better; an absolute scale needs the Viking engineering calibration document, which NSSDCA never archived. Channels 8–15 form a reference ladder that toggles between two fixed levels from run to run, which looks like a gain or configuration bit and is not decoded.
7. Chemical inventory and discovery pipeline
All 14 runs were decoded into a calibrated cube (run → masses 12–215 × scans). Extracted-ion chromatograms are baseline-subtracted with a rolling 31-scan minimum. Discovery combined three tests: co-elution (two or more ions peaking within one scan of each other), an M+2 isotope scan against Cl (0.32), 2Cl (0.65), 3Cl (0.98), S (0.045) and Br (0.98), and full-pattern verification requiring M, M+2, M+4 and a diagnostic fragment in the right ratios at a discrete peak above noise. Contaminants were excluded by correlation with the polysiloxane bleed series (73, 147, 207, 221, 281, 191, 96, 81), whose M+2 comes from 29Si and 30Si, not chlorine.
| Species (ions) | VL-1 Chryse | VL-2 Utopia | Note |
|---|---|---|---|
| H2O (18), CO2 (44), CO/N2 (28), O2 (32), Ar (40), 13CO2 (45) | major | major | bulk and atmospheric; the 1977 result |
| Chloromethane (50/52) | present | present | one Cl; both sites |
| Dichloromethane (49/84/86) | weak | enriched | two Cl; 350–500 °C; absent from the blank in Biemann's own table |
| Chlorobenzene (112/114/77) | noise | present | VL-2 only; the Guzman species |
| Benzene (78/77/52/51) | present | enriched | rises with temperature |
| Polysiloxane bleed, acetone (58/43) | present | terrestrial; excluded | |
| Dichlorobenzene (146/148/150) | not detected | ratios ~1:1:1, need 100:65:11; noise floor | |
| Trichlorobenzene (180/182/184) | not detected | 182/180 ≈ 0.5, need 0.98 | |
| Thiophene (84) | not detected | fragments dominated by CO2 background; no discrete peak | |
| SO2 (64/66/48) | not detected | 66/64 = 0.3–2 everywhere, need 0.045; robust to martian 34S | |
The noise floor is about 105–106 on the lander scale, 10−5 of full-scale water; the integer-m/z tapes have roughly 4.6 × 10⁶ of dynamic range. On that consistent scale the chlorobenzene peak is 5.4 × 10⁶ in 10039, 2.5 × 10⁶ in 10034, 1.3 × 10⁶ in 10041 and below 1.7 × 10⁵ in every Viking 1 run; dichloromethane is 1.1–1.5 × 10⁷ in the Viking 2 350–500 °C runs and below 1.1 × 10⁶ at Viking 1. The single-ratio Cl scan still flags a handful of ions in Viking 1 (m/z 53–56, 65, 77, 104) with Cl-like M+2; none has a credible M+4 or chlorine fragment pattern and they are read as hydrocarbon fragments plus noise, but this triage was not preserved as code and is a fair target for a second look.
8. Chlorobenzene
Run 10039, m/z 112 extracted-ion chromatogram, peak at scan 148 (t = 25.3 min). Averaged over scans 146–149 after baseline subtraction, on the lander scale: m/z 112 = 3.0 × 10⁶, m/z 114 = 8.0 × 10⁵ (ratio 0.27; one-chlorine expectation 0.32), m/z 77 = 4.2 × 10⁶ (1.4 × the molecular ion; NIST gives 0.6–1, the excess is benzene-family background). Chlorobenzene(112)/full-scale water ≈ 4 × 10⁻⁵ in ion current. Guzman et al. quote 0.08–1.0 ppb; converting ion current to concentration needs per-compound response factors that are not available, so this work confirms presence, lander specificity, isotope ratio and elution window, not the concentration.
9. Water isotopes and the D/H budget
Linear (5388/5631) data only. Scans with water above 15 % of full scale and below the clip (97 % of full scale) are used; at the clip m/z 18 stops rising while m/z 19 does not, so the ratio there is biased high. Terrestrial references: HDO/H2O = 3.115 × 10⁻⁴ (VSMOW D/H 1.5576 × 10⁻⁴), 18O/16O = 2.0052 × 10⁻³, 17O/16O = 3.799 × 10⁻⁴.
m/z 20. H218O+ plus Ar2+, subtracted as 0.145 × m/z 40 (the 70 eV Ar2+/Ar+ ratio). In Viking 1 the argon correction is 2–4 %; in Viking 2 it is 20–70 %, so Viking 2 is not used. Viking 1: 18O/16O = 0.89 ± 0.02 × VSMOW.
m/z 17. The OH+ fragment of water; the measured 17/18 ratio of 0.23–0.26 matches the 70 eV reference spectrum and is used as the fragment yield below.
m/z 19. Four contributions:
- HDO+, the quantity wanted;
- H217O+: 3.8 × 10⁻⁴ scaled to the measured 18O by mass-dependent fractionation, 3.6 × 10⁻⁴;
- (18O)H+, the OH fragment of H218O: fragment yield × 18O/16O = 0.24 × 1.8 × 10−3 = 4.4 × 10⁻⁴;
- H3O+ from the ion-molecule reaction H2O+ + H2O, proportional to water density in the source.
The last term is removed by fitting 19/18 against water density (m/z 18 normalized to the run maximum) and taking the zero-density intercept. The two isotopic terms, together 8.0 × 10⁻⁴, are then subtracted. A constant background at m/z 19 (F+ from the Freon-E contaminant, HF+) would make the ratio rise at low density; the binned data show the opposite, and m/z 69 is at the 10−5 level, so no background term is included. Terrestrial water would give an intercept of about 1.15 × 10⁻³.
| Run | Sample, °C | OH/H2O | 18O/16O (× VSMOW) | 19/18 intercept | HDO/H2O | D/H (× SMOW) |
|---|---|---|---|---|---|---|
| 10015 | subsurface, 200 | 0.229 | 0.90 | 1.71 × 10⁻³ | 9.4 × 10⁻⁴ | 3.0 |
| 10018 | subsurface, 500 | 0.247 | 0.88 | 1.58 × 10⁻³ | 7.9 × 10⁻⁴ | 2.5 |
| 10023 | surface, 350 | 0.240 | 0.87 | 1.96 × 10⁻³ | 1.19 × 10⁻³ | 3.8 |
| 10024 | surface, 500 | 0.247 | 0.87 | 2.03 × 10⁻³ | 1.25 × 10⁻³ | 4.0 |
| 10025 | surface, 500 | 0.247 | 0.93 | 1.77 × 10⁻³ | 9.5 × 10⁻⁴ | 3.0 |
| Mean (run-to-run SD 0.6, standard error 0.3) | 3.3 | |||||
Uncertainty. Statistical: intercept standard errors are 4–7 × 10⁻⁵, and the five runs scatter by ±0.6× (standard error of the mean 0.3×). Systematic: replacing the linear H3O+ extrapolation with a quadratic gives 1.7–4.8× (mean 3.5×); the 5th-percentile observed ratio in each run, which no correction can lower, gives 2.3–3.8×, so about 2.3× is the floor. A 10 % error in the fragment yield moves the result by 0.14×. Mass discrimination between 18 and 19 is half of whatever affects 18 versus 20, at most a few percent. The quoted result is D/H = 3.3 ± 0.6× SMOW, systematic range 2–4.5×, robustly above 2×, with 18O/16O ≈ 0.9× and no enrichment.
Excluded runs. All Viking 2 runs, for the argon correction and large H3O+ slopes; their raw ratios are higher (7–13×) and not trusted. Run 10018 (VL-1, 500 °C, anhydrous mode; Biemann notes its effluent divider cycled under the water overload) was excluded in July because its extrapolation went negative; that was the clipped scans, of which it has 196, and with them excluded it agrees with the others.
What changed in September 2026. The July analysis subtracted only the 17O term and kept the clipped scans, and reported 3.9 ± 0.3× from four runs. The two corrections pull in opposite directions and give the numbers above. Direction and order of the result are unchanged. See errata.
10. Residual limits
- Absolute per-run radiometric scale: on the microfilm per-frame annotations, not in the tapes.
- Engineering sensor to °C: needs the unarchived Viking engineering calibration document.
- Attribution of the profile-tape files (5289/5967) to run IDs: not in the files; would need spectral correlation against the labelled tapes.
- Trace organics below ~10−4.5 of water: below the integer-m/z tapes' dynamic range.
- Raw physical telemetry tapes: out of scope.
11. Scripts
| Script | Purpose |
|---|---|
| verify_decode.py, probe_vl2.py | Independent VL-1 / VL-2 re-parse against the committed CSVs |
| capstone.py | Mass calibration; profile-data inventory; chlorobenzene hunt in profile data |
| header_decode.py, find_fields.py, map_runids.py | Header field enumeration and the 32-bit run-ID signature search |
| full_tape_explore.py, full_tape_parse.py, temp_calib.py | Full-tape record layout, engineering block, temperature channel |
| rosetta.py, decode_ibm_tape.py, batch_decode.py, make_clean_cube.py | Float-format test, decoder (lander-wide scale), 14-run cube, corrupt-scan filter |
| discover.py, examine.py, isotope_scan.py, final_discovery.py | Co-elution clustering, isotope scan, siloxane exclusion, chlorine inventory |
| sulfur_hunt.py, sulfur_profile.py | SO2 pattern test in linear and profile data |
| water_isotopes.py, isotope_rigor.py, dh_rigorous.py | Isotopologue ratios; H3O+ and Ar2+ corrections; full m/z 19 budget with uncertainties |
| make_figures.py, make_report.py | Figures and the PDF report |
All scripts and the decoded data products are on the data page.