Water in the martian soil sampled by Viking in 1976 carries about three times as much deuterium as Earth's oceans.
That number was sitting in a set of undocumented binary tapes for nearly fifty years. This site describes how the tapes were decoded, verified, and calibrated, how the chlorobenzene detection of Guzman et al. (2018) was reproduced directly from the digital record, and how the deuterium result was extracted from the strongest peak in the data.
Casey Handmer · analysis June–July 2026 · error-check revision 7 September 2026 · GitHub repository
Why bother with a 1976 dataset
The Viking landers carried the only instrument to measure organic chemistry on the surface of Mars until Curiosity arrived in 2012: a gas chromatograph coupled to a mass spectrometer, the GCMS. Each lander scooped soil, heated it in steps, swept the vapor through a chromatography column and recorded a mass spectrum every ten seconds. The 1977 conclusion was famous and disappointing: water and carbon dioxide, a few chlorinated solvents attributed to contamination, and no organics.
That conclusion has been revisited twice. Phoenix found perchlorate in martian soil in 2008, and perchlorate combusts organics into exactly the chlorinated species Viking saw. Then in 2018 Guzman and colleagues went back to the Viking microfilm and found chlorobenzene in one Viking 2 run. The digital record, however, had never been reanalyzed, because nobody could read it. The tapes at the NASA archive are described as undocumented and unreadable.
In 2019 I reverse-engineered enough of the binary format to recover the raw mass scans, and put the work on GitHub. This project picks that up, verifies it independently, and pushes it to the end: every run labelled, every intensity in physical units, every loose end either closed or bounded by information that no longer exists.
What survived
The record exists in three forms. The raw telemetry tapes are physical media and out of scope. The microfilm holds one bar graph per mass scan, and it is what Guzman used. And there are 32 digital files in four folders at the National Space Science Data Center, two per lander, described only as "full" and "reduced" versions of the data. The working material here is those 32 files, plus five microfilm frames from run 10039 that a volunteer had paired with the corresponding digital records.
Verifying the decode
The first task was to check the 2019 work without trusting it. Autocorrelation of the Viking 1 bit-stream shows a dominant period of exactly 3344 bits, the frame length I had documented. A parser written from that structure alone, with the values read as 9-bit big-endian integers packed three to four bytes, reproduces the committed spectra to 99.97 %. The only three scans that differ are the ones straddling documented frame-writer resets. The Viking 2 file has a different layout, a 62416-bit scan record with one value per 16-bit word, and it reproduces to 100 %.
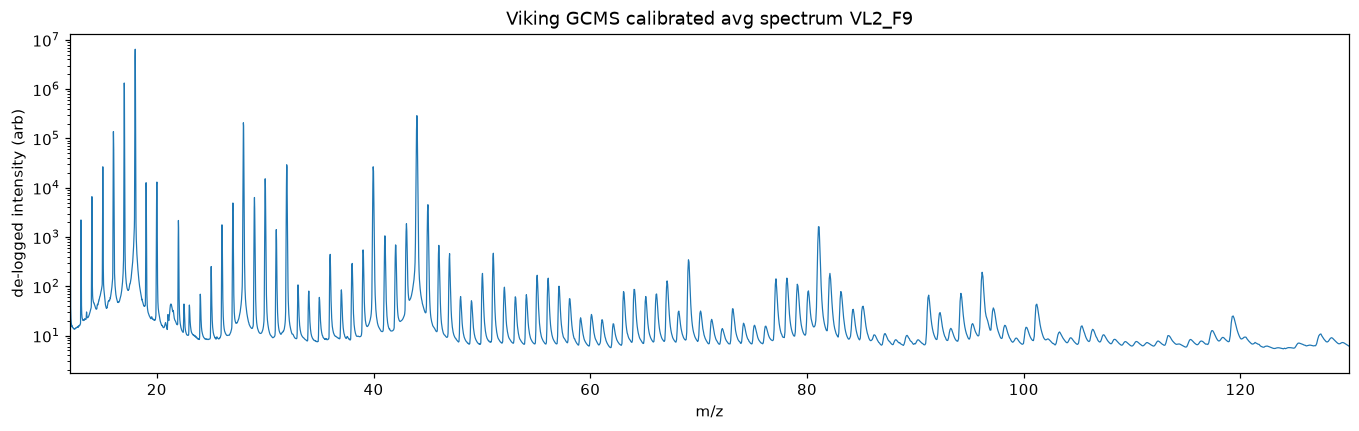
The mass axis follows an exponential law, because the spectrometer scans its accelerating voltage exponentially and voltage is inversely proportional to mass. A fit anchored on the always-present water and carbon dioxide family puts every one of the 16 runs on a mass scale good to better than a tenth of a mass unit. That matters later: it is what lets m/z 112 be told apart from m/z 114.
The tapes were labelled backwards
The archive labels folders 5289 and 5967 as the "full" data and 5631 and 5388 as "reduced." Searching every file for a 32-bit signature, a run number followed by 0x0001, shows the opposite. The 5631 and 5388 files carry a run identifier in every scan record, and those identifiers match the run numbers in Biemann's 1977 acquisition table exactly: 10015 through 10025 for Viking 1, 10032 through 10041 for Viking 2. That single lookup gives each file its sol, sample, oven temperature and carrier gas. The files I had decoded in 2019 are the profile data, 3840 channels per scan but with the identifiers stripped.
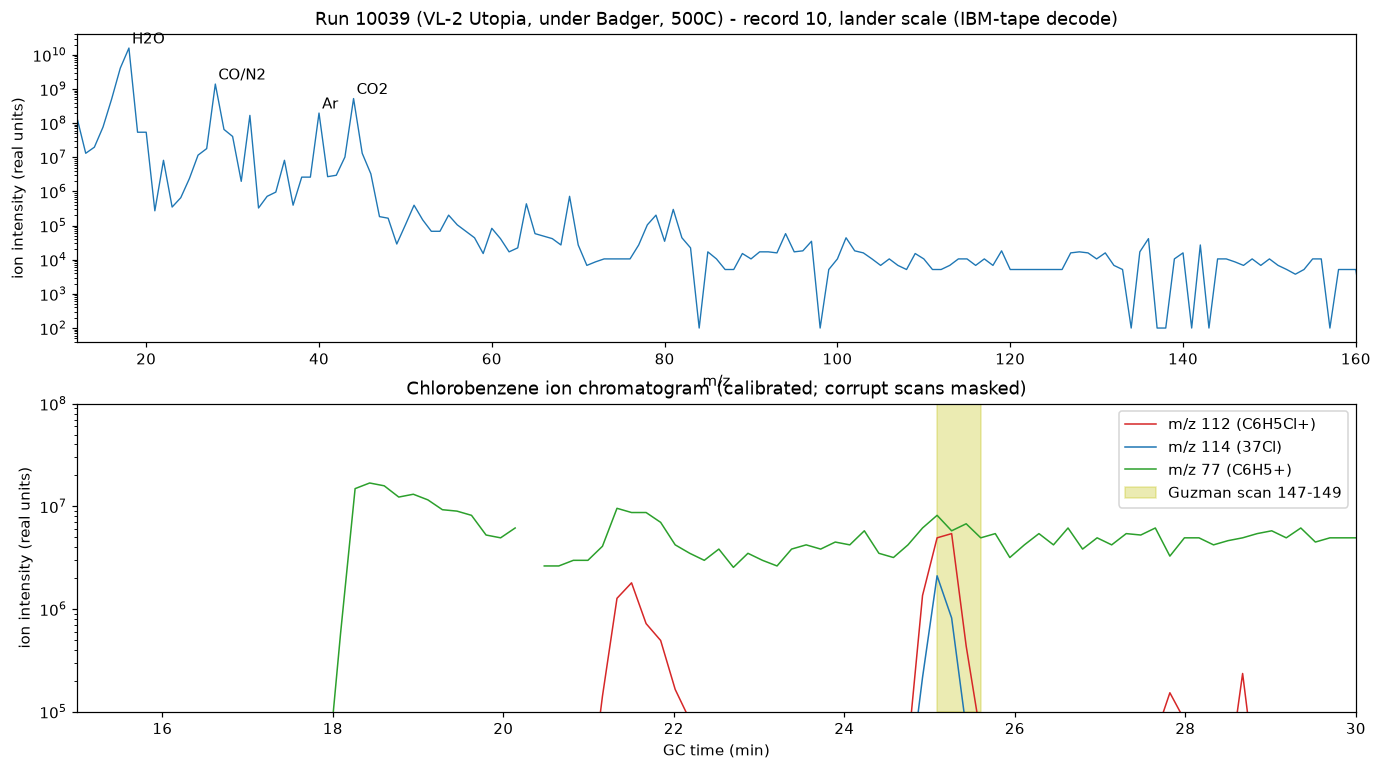
The 5631 and 5388 records also store intensities differently: one four-byte floating-point number per integer mass. Working out the float format needed ground truth, and the five microfilm frames of run 10039 supplied it. Only one reading of the bytes, a 24-bit mantissa followed by a base-2 exponent offset by 64, gives a sane dynamic range and puts water at 18, carbon monoxide at 28, argon at 40 and carbon dioxide at 44 in the right proportions; the microfilm frame turns out to be a scan where water sits at the instrument's full-scale clip, and that clip is the same raw code in every run of a lander, which fixes the intensity scale. With that, all 14 soil runs decode to real-unit, mass-assigned, temperature-labelled spectra.
Chlorobenzene, from the binary this time
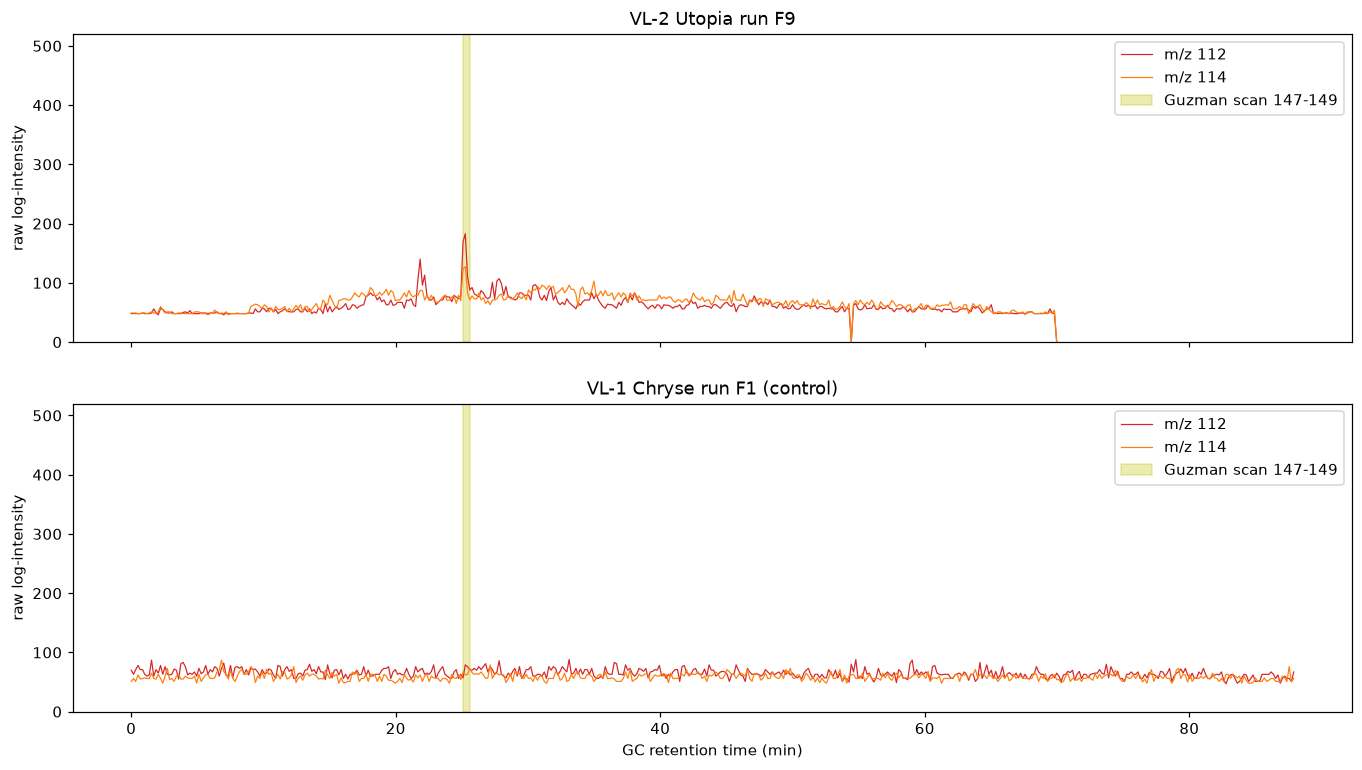
Guzman et al. found chlorobenzene in run 10039, a 500 °C heating of the sample Viking 2 took from under Badger Rock, at about 25 minutes into the chromatogram. The digital record, which they did not use, shows the same thing. The m/z 112 ion peaks at scan 148, 25.3 minutes in. The m/z 114 partner sits at 0.27 of it, close to the 0.32 expected for a molecule with one chlorine atom. The phenyl fragment at m/z 77 co-elutes. The peak is thirty times stronger than anything at that mass in any Viking 1 run, and it also shows up, weaker, in the other 500 °C Viking 2 runs.
The full inventory, and what is not there
With every run calibrated, the obvious question is whether anything was missed in 1977. The search used three filters together: ions have to rise and fall at the same chromatographic time, their isotope partners have to be present in the right ratios (a chlorine atom adds a partner two mass units up at a third the height; two chlorines give two partners; sulfur gives one at 4.5 %), and the pattern has to be a discrete peak above the noise. The honest answer is that the known inventory is the whole inventory. Chloromethane appears at both sites, dichloromethane and chlorobenzene at Viking 2 in the hotter steps, benzene at both sites and stronger at Viking 2. All of it grows from 350 to 500 °C, which is what perchlorate combustion of native organic carbon predicts. Column bleed from the silicone coating and a whiff of acetone are terrestrial and were excluded. Dichlorobenzene, trichlorobenzene and thiophene, all tempting because Curiosity has reported chlorinated benzenes and thiophenes at Gale, sit at this dataset's noise floor and fail the isotope test. Sulfur dioxide fails it too.
That noise floor is about one part in a hundred thousand of full-scale water. It is why Guzman needed the microfilm, and it is where the trace-organic question ends for this dataset.
The pivot to isotopes
If the trace organics are gone, the strongest signal in the data is still there: water, at the top of every spectrum. Its isotopic variants sit a thousand times below it, which is comfortably above the floor that buried the organics. And on Mars the hydrogen isotopes are not subtle. Light hydrogen escapes to space more easily than deuterium, so four billion years of escape have left the atmosphere five to six times richer in deuterium than Earth. Oxygen is too heavy to escape efficiently, so 18O barely moves. A reservoir of water that has exchanged with the martian atmosphere should show heavy hydrogen and ordinary oxygen.
The measurement is a bookkeeping exercise on three masses. Mass 20 relative to 18 gives 18O once doubly-charged argon, which lands at 20, is subtracted. Mass 19 is harder. It carries the deuterated water molecule, but also water with one 17O, the OH fragment of water with one 18O, and protonated water formed when a water ion collides with a water molecule inside the ion source. The last term grows with water density, so it can be removed by following the 19/18 ratio as the water pulse passes through the spectrometer and extrapolating to zero density. Scans where the water signal has hit the instrument's full-scale limit are left out, because there the ratio is artificially high. The two isotopic terms are then subtracted using the measured oxygen ratios and fragment yield. What remains is deuterated water.
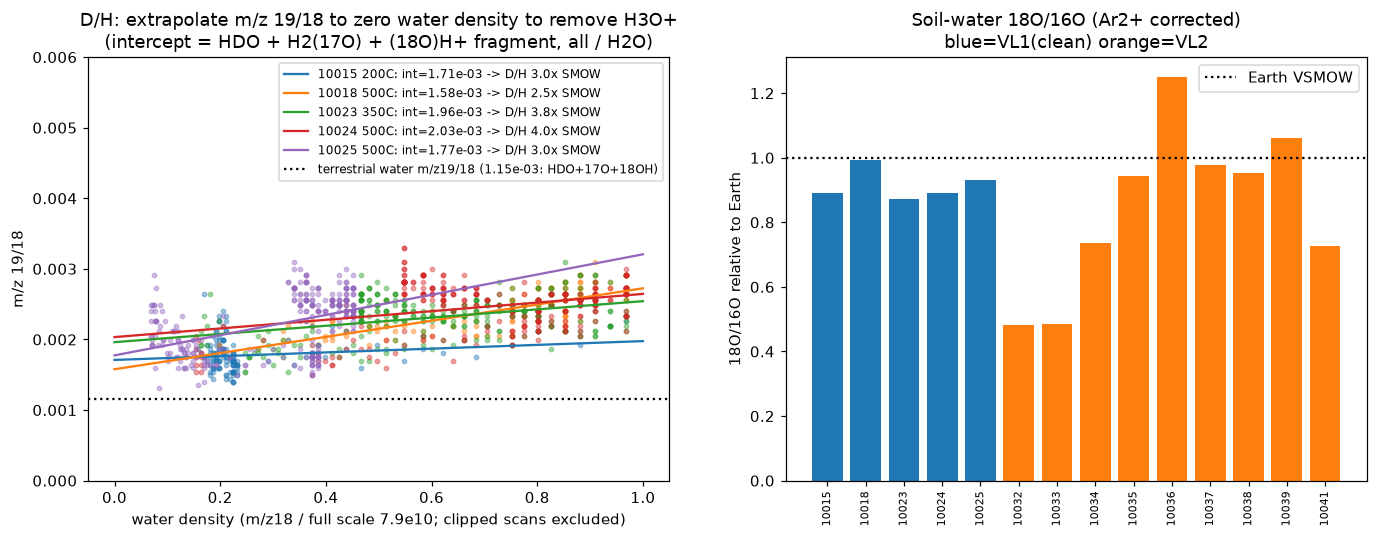
The five Viking 1 runs agree with each other: 3.0, 2.5, 3.8, 4.0 and 3.0 times the terrestrial deuterium ratio, mean 3.3 with a scatter of 0.6. The 18O ratio is 0.89 times Earth's with very little scatter, and a ten-percent offset is within the mass discrimination of a 1970s magnetic-sector instrument, so oxygen reads as ordinary. That is the escape signature. It also lands where later missions say it should: Curiosity measured about 3× in the hydrated clays of Gale crater and 5–6× in today's atmosphere. Soil water that equilibrated with the atmosphere some time ago, when it was less enriched than now, is the natural reading.
Where the information runs out
Two things remain outside the data. The engineering channel that tracks oven temperature saturates at its 9-bit ceiling above about 200 °C and cannot separate the 50 °C run from the 200 °C runs; recovering an absolute temperature scale would need a Viking engineering calibration document that was never archived. And the absolute ion-current scale of each run lives on a per-frame normalization printed on the microfilm, so within-run ratios are exact but cross-run absolute intensities depend on an anchoring convention. Everything else that was unknown in 2019, the frame structure, the mass axis, which tape is which, which file is which run, the float format, the temperature bins, is now known. The methods page has the detail, and the data page has the decoded cubes and every script.